The Stagnant Middle in Pakistan’s Formal Salary Sector (2014–2024)
Using employer-level administrative data from PRAL covering all corporations, state-owned enterprises, and government bodies, as well as partnership businesses and individuals that withhold income tax on salaries, this data story groups employees into five annual salary brackets:
The boarder economic environment that frames this analysis contains two significant shifts. First, in the form of a change in tax policy and second, in form of a negative economic shock. In 2019, the tax exemption threshold for salaried individuals increased from PKR 400k to PKR 600k, permanently removing the first slab from the tax base and altering the trajectory for slab 2. In addition to that, in 2020, COVID-19 came as a negative shock to the economy subsequently followed by high inflation in the years 2022 and 2023.
Finding 1: The Workforce Composition is Shifting Upwards
Figure 1 plots the total number of employees in each of the five salary slabs across ten years, clearly showing the impact of the change in salary tax exemption threshold in 2019 on slab 1 for salary income up to PKR 600,000. Figure 2 plots the share of employees in the salary sector broken down by annual salary slabs in each year. It is evident from Figure 1 that the number of employees in all salary slabs continue to rise steadily over the ten-year period. However, Figure 2 shows that the growth in middle income slabs 2 and 3 stagnated post COVID-19 while the top two income slabs continued to grow. Essentially, the combined share of employees earning salary between PKR 600,000 to PKR 2,400,000 has grown by 43% (~37% to 53%) whereas the combined share of employees earning PKR 2,400,000 and above has grown by 125% (~4% to 9%) over the ten-year period. This trend signals that salary income distribution is becoming top-heavy, and the middle tier of the formal salary structure is thinning.

Figure 1: Workforce composition by Salary Slabs (2014-2024)
Given that the number of employees in the middle salary group remains near-stagnant, especially post-COVID-19, while the upper salary income group steadily increases, shows that there is either no upward mobility from the middle to top income group or perhaps automation, outsourcing, or structural changes in key industries has caused high-skilled workers to shift to high-income groups. Either way, stagnation in the middle salary income group does not bode so well for the economy because, one, it has a direct negative impact on a consistent source of tax revenues for the government, and two, it shifts much of the burden of personal income taxes to the top salary slabs.

Figure 2: Distribution of the Workforce by Salary Slabs(2014-2024)
Finding 2: Salary Growth Patterns are Decoupling from Inflation

Figure 3: Year-on-Year Change in Total Salaries Paid by Salary Slab
Figure 3 plots year-on-year percentage change in total salaries paid within each slab from 2014-2024, alongside annual inflation. While the COVID-19 shock impacted the entire salary distribution, it is evident from the Figure. 3 that top salary slabs demonstrated the strongest recovery from it. This resilience indicates that certain high-paying jobs were concentrated in sectors that were quickly able to adapt to remote or hybrid schemes of work to withstand the impact. It is also interesting to note that in years of high inflation, such as the period from TY2022 to TY2023, real salaries remained stable and, in some cases, even grew for top income slabs, allowing them to retain purchasing power, whereas real incomes for the middle-income slabs eroded. It can be concluded that the share of middle-income earners is unable to keep pace with the rising cost of living, steadily but surely diminishing their purchasing power. It is these asymmetrical responses to economic shocks that highlight structural inequalities and require targeted policy interventions to support and rebuild middle-income groups.
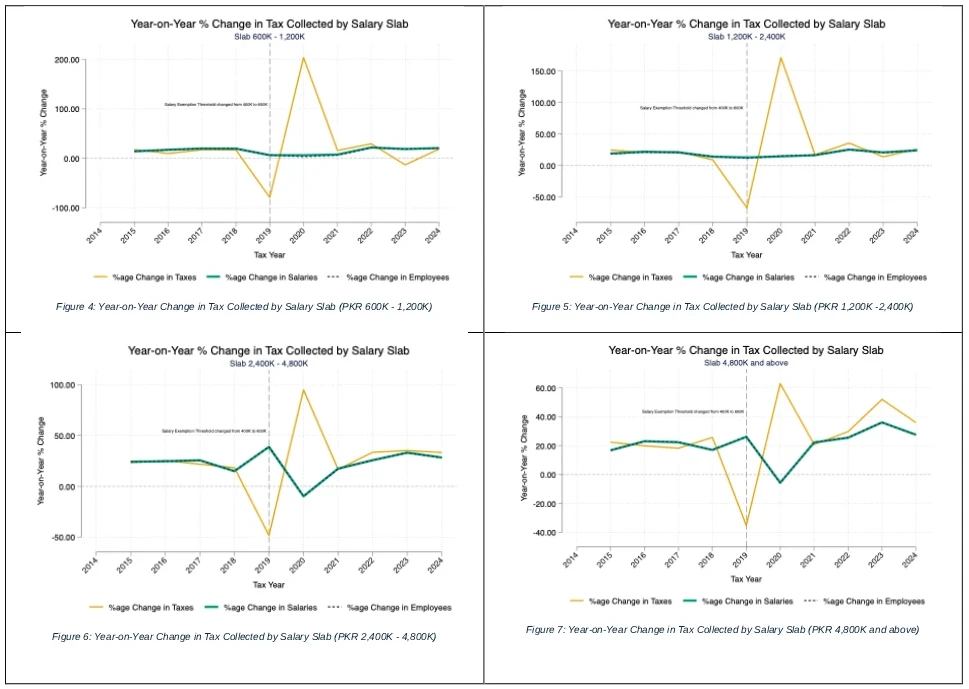
Finding 3: The Policy Shock of 2019 Reshaped the Tax Base
Figure 4-7 plot the year-on-year change in salaries paid against the year-on-year taxes deducted from salaries during the period TY2014-2024 separately for every slab. There are four inferences that can be drawn from these graphs:
1. Data is sourced from PRAL and is based on withholding tax declarations by employers in the formal sector.
It is to be noted that this data is based on 233,966 withholding tax declarations filed by employers with the tax authority over the 10-year period observed and contains data on 13,021,064 employee salaries disbursed over the same period. As the dataset is based on self-reported declarations, it is important to acknowledge that in some cases, taxes deducted from salaries are not deposited into the government exchequer and hence will not be reported in the withholding statements. The analysis is thus sensitive to reported figures.
The next data story will focus on the same analysis, except data will be drawn by employee declarations instead of employer declarations. Stay tuned!
Dr. Zehra Farooq is Secretary of Revenue Operations and Analysis at Pakistan’s Federal Board of Revenue and a Fulbright alumna with a PhD in Economics from the U.S. She leads evidence-based tax reform and has represented Pakistan on international forums, recently joining the inaugural cohort of the IIE Global Community for Women’s Leadership as the only woman from Pakistan. She can be contacted at zehra.farooq@gmail.com